
BRAZIL TREASURY SECURITIES: ANALYSIS AND PROPOSALS FOR FURTHER DEVELOPMENT
By Tarcísio Godoy
"I used to think that if there were reincarnation, I wanted to come back as the President or the Pope. But now I want to be the bond market: you can intimidate everyone" (James Carville, election adviser to President Clinton)
TABLE OF CONTENTS
1 INTRODUCTION *
2 SOME DEFINITIONS AND GENERAL MACROECONOMICS ASPECTS *
3 THEORIES OF SECURITIES MARKET *
3.1 Determinants of the prices of the securities *
3.2 Efficient Markets *
3.3 Behavior of Efficient Market *
3.4 The Term Structure Theories *
3.5 Segmented Markets, Increasing Liquidity Premiums and Preferred Habitat *
3.5.1.1 Segmented Markets *
3.5.1.2 Increasing Liquidity Premiums *
3.5.1.3 Preferred Habitat *
3.5.1.4 Money Substitute *
3.5.1.5 Expectations Hypothesis – Unbiased Hypotheses *
3.5.1.6 Combining the Unbiased Expectations Hypothesis with the Increasing Liquidity Premium Theory *
3.6 Bond Price Volatility Measures *
3.7 Duration, Elasticity and the Interest Rates *
3.7.1.1 Duration *
3.7.1.2 Elasticity *
3.8 Common types of securities used by the governments to finance their deficits *
3.8.1.1 The German Public Debt *
3.8.1.1.1 Germany’s Economic Indicators *
3.8.1.1.2 Instruments used by German government to finance its debt *
3.8.1.2 The French Public Debt *
3.8.1.2.1 France’s Economic Indicators *
3.8.1.2.2 Instruments used by French government to finance its debt *
3.8.1.3 The Italian Public Debt *
3.8.1.3.1 Italy’s Economic Indicators *
3.8.1.3.2 Main instruments used by Italian government to finance its debt *
3.8.1.4 The Chilean Public Debt *
3.8.1.4.1 Chile’s Economic Indicators *
3.8.1.4.2 Instruments used by Chilean government to finance its debt *
3.8.1.5 The Brazilian Public Debt *
3.8.1.5.1 Brazil’s Economic Indicators *
3.8.1.5.2 Main instruments used by Brazilian government to finance its debt *
3.9 Some Market Instruments to Improve Liquidity *
3.9.1.1 Options *
3.9.1.2 Repurchase agreements (Repo Market) *
3.9.1.3 Separates Trading of Registered Interest and Principal (STRIPs) *
3.10 U.S Treasury Debt Management *
4 BRAZIL TREASURY SECURITIES *
4.1 Background, Regulation, Size and Growth *
4.2 Main instruments *
4.3 Treasury Actions and Primary Market Data *
4.4 Data of the Secondary Market of Brazil Treasury securities. *
5 CONCLUSIONS AND PROPOSALS FOR FUTHER DEVELOPMENT ON TREASURY SECURITIES *
6 REFERENCES *
The Brazil’s net public debt reached 34% of its gross domestic product – GDP, in 1997. It includes domestic and external debt and all level of governments (federal, states, and municipalities).
In the federal level, the total outstanding debt of Brazil represented by marketable bonds reaches US$ 300,0 billion. It represents only a part of the total debt in the federal level. These numbers by themselves enhance the importance of the discussion of this issue as well as call for our attention to the necessity of maintaining the debt managers updated with the latest theories of money market.
This paper was written to present the theories on securities usually applied to debt management. The objective was to describe these theories and then, considering the securities issued at the federal level by Brazilian Treasury, make proposals for further development of its secondary market.
Beginning with a brief definition of the main technical terms used by fiscal policymakers and debt managers, the paper presents an overview of macroeconomic policy, highlighting the fundamentals of Plano Real, and also explains the role of the Treasury in the Brazilian government.
In order to present the theories that we considered relevant, we were very brief in each one mentioned. For those who have more interest in specific theories, there are references at the end of the paper.
Then, we have data concerning the securities usually issued by U.S., Germany, France, Italy, and Chile. The data were included in the paper because these countries have well-developed money and capital markets.
A concise history, the size of the market, instruments and other data on Brazilian Treasury securities are presented to the reader. Data of primary and secondary market are organized and then displayed in the paper. We also interviewed domestic and international traders of Treasury securities. The objective was to know their perspective about improvements that could be implemented within the secondary market of Treasury securities.
Finally, based on the present macroeconomic conditions, the theories and data considered, we reported some findings and make proposals to further develop of the secondary market of Treasury securities.
The difference between government’s expenditures and revenues (taxes) generates public surplus or deficits. If, during a period, the sum of these results are negative, the deficit financing creates public debt.
The deficits can be measured in two concepts: primary, when we do not consider the results of the revenues and payments of interests; operational, when we add or subtract the results of the interest account.
Brazil’s statistics also sub-divide the deficits into two others categories. After adding of the results of the interest account, we have the nominal and the operational results. The first one considers the variation of the debt nominally. The operational result considers the variation of the debt, without the inflationary effects.
The Public Sector Borrowing Requirement – PSBR measures the variation of the net public debt too, but as a flow during the fiscal year. The PSBR is equivalent to the concepts of deficit shown above. Thus, PSBR can be shown as a primary or operational result.

There is another way for the government to generate debt. Debt can be generated as an instrument to implement monetary policy and maintain regulation of the money supply within the economy. In the beginning, this kind of debt does not imply a rise in the net public debt. Nevertheless, eventually, the interest over this debt also affects the operational result, generating a rise in the net public debt.
The debts are classified as gross or net depending on whether the financial assets are considered or not. When these assets are not deducted from the total of the debt, which means we have the gross debt. On the other hand, when the assets are deducted from the total of the debt, we have net debt.
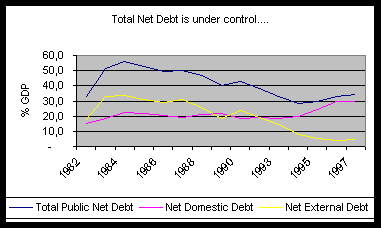
Usually, in order to manage their debt, Governments issue securities. Government securities are obligations of the state with respect to borrowed money. They are generally transferable with a defined rate of interest and a maturity date. These instruments have been used by governments to borrow money from firms and households. Because of the great deficits of the last years (maybe decades) the government has been having an increasing role in the financial market.
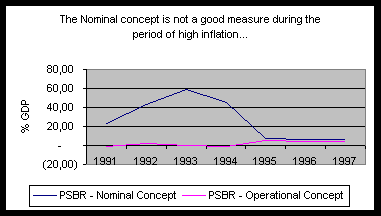
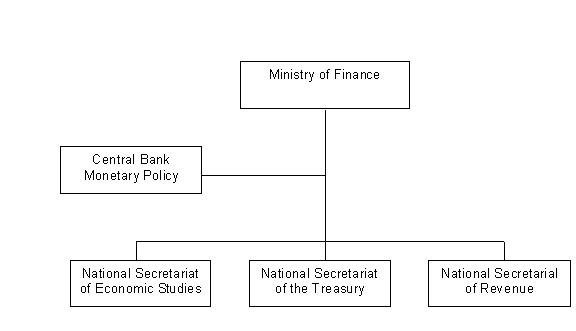
In Brazil, the Central Bank is responsible for issuing securities to regulate the money supply. As mentioned, this kind of security does not increase the net public debt. In the federal level, the Ministry of Finance – MoF is in charge of issuing securities to meet the fiscal deficit between expenditures and taxes. Nowadays, the other levels of governments – States and Municipalities – are forbidden from issuing securities.
Within the MoF, the Secretariat of the Treasury is the organ responsible for all procedures related to the issue and payment in the federal public debt. The securities issued to attend this expenditure are Treasury securities.
The relevant aspect for government whom issues securities is the legal framework. By the 1988’s Constitution of Brazil, the lenders of the Treasury have two important mechanisms to guarantee their rights:
Since Brazil had been suffering a huge inflationary process for the last two decades, the Plano Real was launched in 1994 with the target to finish this process. The fundamentals of Plano Real are based on:
As we could see, Plano Real has strong macroeconomic fundamentals. It is affecting all three markets of the macroeconomic circular flow theory. Thus, Plano Real is affecting the labor market by investing in education and the market of goods by reducing the tariffs and non-tariff barriers to import. At last, the financial market has been modernizing by Privatization and consequently reducing the public debt and by stabilization of the money supply.
However, the period of transition needs to be viewed carefully. To maintain the competitiveness and growth, Brazil is having successive current-account deficits. Moreover, to finance these deficits, the Central Bank has maintained high level of interest rates to stimulate the flow of capital into the country. Contrarily, this policy could restrain the growth of the country as well as increase the burden the operational results of the Treasury.
What we could highlight, within the security market, is the several instruments developed by the Treasury to serve as currency in the Brazil Process of Privatization. These currencies served and still are serving as form of payment for whom wants to buy companies sold under the Brazilian Process of Privatization.
Usually sold at secondary market as a high yield bond, these securities helped the Treasury to reschedule its debt and they also have encouraged investors to participate in the bids of these companies. In addition, as the Treasury rescheduled all its past debt, nowadays Brazil does not have event of default in its records anymore. However, note that the markets always remember default events.
Nevertheless, the Treasury has implemented some attitudes to stimulate the investors to investing in its securities. They are:
So far, we believe that all these policies have reduced the cost of Brazil Treasury’s securities.
Many factors affect the prices of the securities. Among them, we can highlight the inflation or change in price level and debt’s growth rate of the issuer. In the last times, the flows of capital through the international financial market also have been having a relevant role in the prices of the securities.
Each fact that affects the price of security will do it by changing the interest rates. Besides this, the interest rates’ expectation changes during the maturity period of the security. Thus, what determines the prices of long term securities is the current expectation of the future interest rates.
As interest rates have been highly variable, the stakes in the interest rate game have also increased. For all participants in the financial markets, two interrelated decisions have become important:
The risk of making errors in these decisions has been called interest rate risk; one of the main topics discussed daily on financial market.
The higher is the variability of the interest rates’ expectation, the higher will be the risk of bearing a security, for both the borrowers and the lenders. Consequently, the price would depend on how efficient is the market to predict the future interest rates.
In competitive security markets, all market participants have profit incentives to seen out and act on any information, any new information publicly available to everyone affects market prices very rapidly, as competing markets try to make as much profit as possible. When the market adjusts the prices instantaneously at which new information, it is called an informationally efficient market.
In efficient markets, all current information is reflected in the interest rate, suggesting that changes in the interest rates in the future are essentially random. There is no way to foresee whether the interest rates are high or low relative to future interest rate. There is no best time for Governments to borrow money. There is no best time for anybody to lend money to Governments.
Governments would prefer to borrow money only in short-term if the interest rates were high. Lenders would prefer to lend money only in the long-term if the interest rates were high. There would be no optimal maturity decision.
The efficient market can be broken into three sub-hypotheses, which differ according to the type of information available for all participants of the market (governments, households, business, and financial institutions: Weak-Form, Semi-strong Form, Strong Form of efficiency.
It is called weak form of efficient market when past price and volume of trading information are instantaneously incorporated into current prices. Therefore, this knowledge does not allow prediction of future price changes.
 Assume the following timeline:
If the today’s price incorporates all information of yesterday’s price, we can say that the knowledge of a price yesterday conveys no information about tomorrow’s price changes. In other words, all information was available yesterday and was considered instantaneously into the today’s price.
Thus, the expectation of tomorrow’s price is today’s price or today’s price is the best predictor of tomorrow price. Yet, rising prices yesterday do not imply rising or falling price tomorrow.
Then:
E(Pt+1) = Pt or E(Pt+1) – Pt = 0
The viewpoint that price changes cannot be predicted has been called random walk hypothesis. According to this hypothesis, price changes are drawn from a probability distribution, which does not change over time.
Nevertheless, the weak form of efficient market occurs only in a short time of period.
Over long periods of time, what we can observe are prices of some securities have an upward price trend. Over shorter intervals, the uptrend can be ignored for practical purposes.
Over long time intervals, the upward price occurs in order to represent a return for the time value of money and for risk. If we adjust the expectation of the tomorrow’s price adding the risk, what we have is price fluctuate randomly around this uptrend.
Concerning bonds and interest rates, the random walk hypothesis suggests essentially random or unpredictable changes. After extensive empirical tests, the evidence supports and indicates this hypothesis is consistent and indicates no simple and stable relationship between price changes at different points in time.
The second hypothesis of efficient market is called the semi-strong hypothesis. Tests in this model must distinguish between anticipated and unanticipated information. The anticipated information should already be incorporated into a security price. For the unanticipated information or surprises, they will immediately impact upon the prices.
For example, in Brazil, the current-account deficit announcements by the Government have been used as a determinant of interest rates. To test the impact of current-account deficit announcements upon interest rates, the actual announcements must be decomposed into anticipated and unanticipated amount. In a semi-stronger efficient market, the anticipated amount should be incorporated into prices before the announcement. Surprise deviations of the actual prices from the anticipated price result in rapid price adjustments within a semi strong efficient market.
Finally, the third and last hypothesis of efficient market is called strong form efficiency. In this hypothesis any information available to special groups of investors has already been incorporated into security prices and, therefore, is of no real value to these investors.
The most important question, so far, is "How should investors behave in an efficient market, since earning more than a fair rate of return is extremely difficult".
Three points answer this question:
Considering that in an efficient market the securities are fairly priced most of the time, the competitive nature of security markets makes it very hard to earn more than a fair return on a risk-adjusted basis.
However, not all investors would abandon the search for inefficiency in form of mispriced securities. So, paradoxically, when all participants of the market assume a perfectly efficient market, the market would be imperfect.
According to he theory, these "nonbelievers" players seek out gain opportunities and force the market toward efficiency.
In an efficient market investors will be remunerate in according of their behavior. The different choices of the players will be reflected upon the interest rates’ term structure.
Interest rates differ by maturity, or term. This item focuses on some approaches of the term structure theories to explain how is the relationship between interest rates and maturity. Term structure can be rising, flat, declining, or humped.
According to some studies, the most frequent shape for a yield curve is upward sloping. Downward-sloping yield curves have occurred at the end of the expansion phase of business cycles. At these cycle peaks, heavy demand for credit, inflationary pressures, and tight money tend to push all interest rates to high levels. This cycle pattern implies the following three empirical regularities for term structure:
The evidence has been indicating a fourth regularity, independent of business cycle, and empirical tests indicated a fifth regularity:
However, each of the following theories provides some insights, but none of them explains completely the behavior of the yield curves and their empirical regularities. The table behind summarizes the predictive value of the various theories:
|
Theory |
Consistent with |
||
|
Yield Curve Shapes |
Empirical Regularity Number |
||
|
Segmented Markets |
Any |
|
|
|
Increasing Liquidity Premiums |
Rising |
3,5 |
|
|
Preferred Habitat |
Any |
|
|
|
Money Substitute |
Rising |
4,5 |
|
|
Local Expectations |
|
|
|
|
Unbiased Expectations |
Any |
|
|
|
Combined |
Any |
3,5 |
|
The segmented market theory says that a separate market exists for each maturity. Demand and supply for funds set interest rates for each maturity. According to this theory, investors do not shift between different maturities. In segmented markets theory, some investors, like commercial banks, confine their holdings to short maturity, whereas other investors, such as life insurance companies, will purchase and hold only long term bonds.
The segmented markets theory is consistent with any shape of yield curve, but it does not predict any of the empirical regularities of the term structure. Bonds with different maturities are not perfect substitutes for investors. According to this theory, perfect substitutes should not have the same holding returns. If bonds with different maturities have different holding period returns, they are imperfect substitutes and markets are segmented by maturity.
In the theory of increasing liquidity premiums, yields increase as maturity increases for two reasons: risk and return. Since investors are averse to risk – that means they prefer lower variability of return; they require higher yields to maturity on long term bonds to compensate for the higher risk and higher transactions costs.
A utility function shows the relationship between utility and the terminal wealth from an investment. All rational investors prefer more wealth to less; their utility functions have a positive slope. For risk-averse investors, additional values of wealth add smaller amounts of utility; consequently, there is a concave utility function. For risk-seeking investors, additional values of wealth add increasing amounts of utility, implying a convex utility function.
Another way to analyze the increasing liquidity premiums’ theory is in terms of equivalent. A certainty equivalent of gamble with risky outcomes is defined as an amount of money with certainty making an investor indifferent between the certain cash and the gamble.
If decision-makers’ certainty equivalent equal the expected value of gamble, the decision-makers are risk neutral. They will be risk-averse (risk-seeker) if the certainty equivalent is less (more) than the expected value of the gamble.
The liquidity preference theory also overlooks bond issuers. In a real world, some issuers prefer long-term funds, either to locking in a fixed interest rate or to reducing liquidity pressure, and, others prefer short-term funds, or intermediate funds. A complete term structure should account for the maturity needs of all borrowers.
The theory of increasing liquidity premiums implies yield curves that are always rising. However, the empirical evidence contradicts this implication. Yield curves sometimes slope upward, but sometimes the yields might have a downward or humped slope.
In the preferred habitat theory, investors prefer to purchase bonds of particular maturity – not necessarily short or long term – and require higher yields to buy bonds of other maturities. This theory combines the theory of the segmented markets and the theory of increasing liquidity premiums.
Instead of always preferring short maturities, as suggested by liquidity preference theory, investors may prefer other maturities, depending upon their individual investment objectives. Instead of being completely averse to shifting from the preferred maturity as in the segmentation theory, the preferred habitat theory suggests a willingness to purchase nearby maturities, but only at higher interest rates. For maturities farther from the preferred habitat, the required interest rates are higher to compensate the buyers for the risks that they are not willing to have.
The preferred habit theory is consistent with any shape of term structure. This theory allows for the possibility that shorter-maturity bonds might be riskier. Nevertheless, the theory does not predict any of the five empirical regularities.
According to the money substitute theory, many investors restrict their purchases to short term money market instruments because the risks associated with these are very small. Consequently, the prices of money market instruments are driven up and their rates are down relative to longer maturity rates.
This theory assumes a large number of investors in short-term, with a stronger preference for short- maturities than issuers. The main justification of this belief is the restricted options available to these short-term investors.
An additional justification of money substitute theory is the preference of issuers for somewhat longer maturities. It would happen to minimize the costs of issuing securities, which would attempt to reduce the frequency of issue by issuing longer-maturity instruments.
The most widely discussed theory of the term structure of interest rates is the expectation hypothesis. This theory is composed of several similar, but different theories. The unbiased expectation hypothesis is the most widely discussed of the expectation theories.
In the unbiased expectation hypothesis, the current forward interest rates are determined by market’s anticipations of future interest rates. For the two-period case, the forward rate for period 2 is an unbiased predictor of the one-period rate observed one-period later.
The unbiased expectation hypothesis is consistent with any yield curve shape. Under this hypothesis, a flat yield curve occurs if the market expects all future interest rates to equal the current one-period rate. If the market expects rising future interest rates, the yield curves rises and the current rate also rise. If forward interest rates decline, the current rate also decline and as outcome, the slope of the yield curve is downwards.
An unusual and interesting yield curve shape is the humped yield curve. Under unbiased expectation hypothesis, humped yield curves occur if the market expects interest rates to rise for a while and then to decline.
Some observers have questioned this theory for making the unrealistic behavioral assumption that investors can forecast very distant future interest rates. These distant forecasts are essential for setting the forward interest rates. How can investors forecast interest rates 5, 10 or 15 years into the future when there is so much uncertainty about events over these long horizons?
Combining the unbiased expectation theory with the increasing liquidity premium theory, it results in a more powerful theory. This combined theory is consistent with any shape of the yield curve and predicts upward sloping yield curves most of the time.
In the combined theory, the forward interest rate equals the expected future rate plus a liquidity premium.
With the combined theory, even a declining term structure is possible though liquidity premiums increase with the maturity. The current yield curve might decline because the fall in the expected future rate is greater than the increase in the liquidity premium.
An important information to risk-averse investors is how fast the bond price goes down as interest rates rise. The volatility of a security measures the sensitivity of bond prices to changes in interest rates. Literature discusses two main measures of the interest sensitivity of bonds: Macaulay’s duration and elasticity. In fact, both of them are virtually identical.
The basic conclusion is that the most (less) risky bonds to hold are long-maturity (short-maturity) and low (high) coupon bonds. The following findings explain this conclusion:
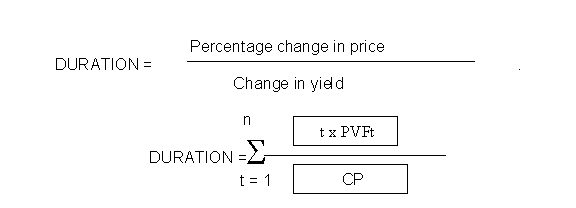 Duration, the most common measures of volatility, had its first formulation in 1938 by Frederick Macaulay. He defined duration as a weighted average term-to-maturity of the cash flow of a security. Duration measures the sensitivity of the price changes when interest rate changes. Mathematically, Macaulay duration can be show as follows:
Where:
t = period in which the cash flow is expected to be received
PVFt = Present value of the cash flow of the security where the present value is determined using the yield-to-maturity.
n = number of period in which the security is redeemed.
CP = current price
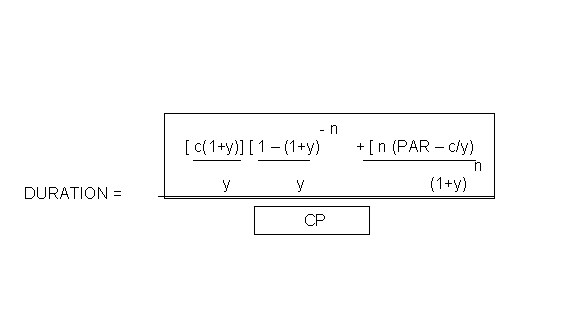 Computing duration using the above formulation can be time consuming, depending on the number of periods in which the security is redeemed. To make easy the computations, it is convenient to take sum in the numerator analytically, resulting in:
Where:
.c = value of each coupon to be redeemed
. PAR =value of last redemption
y = yield to maturity
CP = current price
From these formula we can deduce the following properties:
A perpetual bond, where n tends to be infinite, has duration equal to (1+y)/y
The following charts show the relationship between duration, maturity and coupon level and how is the behavior of the duration in relation of the maturity for given yield.
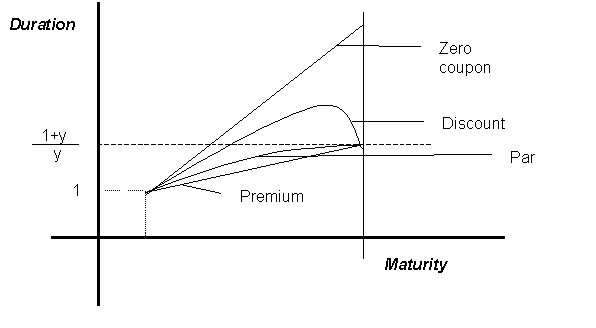
Duration for Various Coupons and Maturities
Yield to Maturity of 12%
|
Maturity |
Coupon |
|||||||||||
|
0 |
0.04 |
0.06 |
0.08 |
0.10 |
0.12 |
|||||||
|
1 period |
1,00 |
1,00 |
1,00 |
1,00 |
1,00 |
1,00 |
||||||
|
2 periods |
2,00 |
1,96 |
1,94 |
1,92 |
1,91 |
1,89 |
||||||
|
5 periods |
5,00 |
4,55 |
4,39 |
4,25 |
4,14 |
4,04 |
||||||
|
10 periods |
10,00 |
7,77 |
7,22 |
6,84 |
6,55 |
6,33 |
||||||
|
15 periods |
15,00 |
9,60 |
8,77 |
8,25 |
7,89 |
7,63 |
||||||
|
20 periods |
20,00 |
10,36 |
9,46 |
8,94 |
8,60 |
8,37 |
||||||
|
30 periods |
30,00 |
10,33 |
9,70 |
9,37 |
9,16 |
9,02 |
||||||
|
Perpetual bond has duration of (1+y)/y = (1+0.12)/0.12 = 9.33 |
||||||||||||
Elasticity is another volatility measure of bond prices. Elasticity is equal to percentage change in security price compared with the percentage change in interest rates.
Mathematically, elasticity is equal to - Dy / Dp
Thus, we can demonstrate that elasticity is duration time y/(1+y). That means elasticity is equal to a security’s duration divided by the duration of a perpetual bond, y/(1+y)
There are very interesting insights that we can take out of the elasticity properties. Among them, as interest rates increase, elasticity increases for zero coupon, par, and premium securities. Nevertheless, for discount bonds, elasticity increases except for very long maturities.
This result implies in the following converse. First, when interest rates increase, the elasticity of the bonds decreases if the underlying price volatility of the bonds remains constant because of the mathematics of calculus. Second, when comparing two securities with different levels of interest rates, the security with higher interest rate has lower elasticity in the case where the underlying price volatility is the same. As mentioned, the volatility measured by duration increases when the security has higher interest rates.
These apparent contradictions bring us the question about the ideal measure of volatility. When interest rates are constant, either duration or elasticity have equivalent results. However, we observe that with interest rates are increasing or decreasing the two measures provide different results.
Generally, surveying the international experience can help the development of the domestic securities market. Nowadays, as the domestic securities markets are becoming international, everyone should be familiar with at least the names of the main securities issued in each country. Having in mind the main economic indicators for those countries within the largest securities markets, and those who are competitors for international flows of money, certainly makes difference.
The next section bring some data of these important countries besides of the Brazil data.
1. Germany’s Economic Indicators
|
Indicator |
1994 |
1995 |
1996 |
|
Real GDP (yoy % change) |
2.9 |
1.9 |
1.5 |
|
Consumer Price (yoy %change) |
2.7 |
1.7 |
1.4 |
|
Current account as % GDP |
-1.0 |
-0.9 |
-0.8 |
|
Public Debt as % GDP |
54 |
N/A |
N/A |
|
Budget Balance as % GDP |
-5.1 |
-4.0 |
-4.6 |
2. Instruments used by German government to finance its debt
|
Federal Gov't. Bonds ( Bunds) |
Federal Gov't. Notes (Kassen) |
Treasury Discount Paper (U-Schatze) |
Federal Gov't. Debt (OBLEs) |
|
|
Term |
From 6 to 30 years |
From 2 to 6 years |
Up to 2 years |
|
|
Issuance |
Issues are listed on all 8 German stock exchange |
Irregularly |
They are sold by Bundesbank as part of monetary Policy |
Issued in TAP form |
|
Coupon Frequency |
Annual/fixed |
Annual/fixed |
Annual/zero coupon |
Annual/fixed |
|
Interest Payment |
Annually |
Annually |
Annually |
Annually |
1. France’s Economic Indicators
|
Indicator |
1994 |
1995 |
1996 |
|
Real GDP (yoy % change) |
2.9 |
2.2 |
0.9 |
|
Consumer Price (yoy %change) |
1.7 |
1.7 |
1.9 |
|
Current account as % GDP |
0.6 |
1.0 |
1.0 |
|
Public Debt as % GDP |
38.6 |
42.7 |
44.7 |
|
Budget Balance as % GDP |
-5.4 |
-4.8 |
-4.0 |
2. Instruments used by French government to finance its debt
|
Discount Treasury Bills (BTF) |
Interest Bearing Treasury Bills (BTAN) |
|
|
Term |
13, 26 and 52 weeks |
2 and 5 years |
|
Issuance |
13 weeks weekly; 26 weeks at each quarter and 52 weeks monthly |
Monthly |
|
Coupon Frequency |
Zero coupon |
Annual/fixed |
|
Interest payment |
NIHIL |
Annually |
1. Italy’s Economic Indicators
|
Indicator |
1994 |
1995 |
1996 |
|
Real GDP (yoy % change) |
2.2 |
3.0 |
0.8 |
|
Consumer Price (yoy %change) |
3.9 |
5.4 |
3.9 |
|
Current account as % GDP |
1.5 |
2.5 |
2.8 |
|
Public Debt as % GDP |
118.0 |
117.0 |
117.5 |
|
Budget Balance as % GDP |
-9.3 |
-7.2 |
-6.7 |
2. Main instruments used by Italian government to finance its debt
|
Treasury Bills Bouni Ordinari del Tesoro (BOT) |
Treasury Bonds Bouni del Tesoro Poliennali (BTP) |
Treasury Certificates Certificati di Credito del Tesoro (CCT) |
Treasury Options Certificates – Certificacati del Tesoro con Optizione (CTO) |
|
|
Term |
3, 6 and 12 months |
3, 5, 9, 10 and 30 years |
7 years |
6 years with putable after 3 years. |
|
Issuance |
Twice each month |
Fortnightly |
Monthly |
Monthly |
|
Coupon Frequency |
Zero coupon |
Semi-annual/Fixed |
CCTs are floating rate notes to BOT plus a spread. Semi-Annual coupon |
Semi-Annual |
|
Outstanding Public Debt |
24% |
32% |
33% |
4% |
1. Chile’s Economic Indicators
|
Indicator |
1994 |
1995 |
1996 |
|
Real GDP (yoy % change) |
4.2 |
8.5 |
6.5 |
|
Consumer Price (yoy %change) |
9.0 |
8.2 |
6.6 |
|
Current account as % GDP |
-1.3 |
0.3 |
-3.3 |
|
Public Debt as % GDP |
N/A |
N/A |
N/A |
|
Budget Balance as % GDP |
1.7 |
2.6 |
2.0 |
2. Instruments used by Chilean government to finance its debt
|
T-Bills Pagarés Descontables de Chile (PDBC) |
Treasury Notes Pagarés Reajustables de Chile (PRBC) |
Treasury Bonds Pagarés Reajustables del Chile com Pago en Cupones (PRC) |
|
|
Term |
Up to 30 days |
Up to 90 days |
From 8 to 20 years |
|
Issuance |
Weekly |
Twice each week |
Twice each week. |
|
Coupon Frequency |
No coupon |
No coupon |
Floating + 6.5% |
|
Interest Payment |
NIHIL |
NIHIL |
Semi-Annual |
5.The Brazilian Public Debt
1. Brazil’s Economic Indicators
|
Indicator |
1994 |
1995 |
1996 |
|
Real GDP (yoy % change) |
|||
|
Consumer Price (yoy %change) |
|||
|
Current account as % GDP |
|||
|
Public Debt as % GDP |
|||
|
Budget Balance as % GDP |
2. Main instruments used by Brazilian government to finance its debt
|
Treasury Bills Letras do Tesouso Nacional (LTN) |
Treasury Financial Bills Letras Financeiras do Tesouro (LFT) |
Treasury Notes Notas do Tesouro Nacional (NTN) |
Central Bank Bills Letras do Banco Central (LBC) |
|
|
Term |
Up to 30 year. Currently is issued by 3, 6 and 12 months |
Up to 30 years. |
Up to 30 years. Currently is issued by 3 and 5 years |
Up to 1 year. |
|
Issuance |
Weekly |
Irregularly |
Weekly |
Weekly |
|
Coupon Frequency |
Zero coupon |
Zero coupon. LFTs are floating rate securities to dairy interest rates on the Treasury secondary market plus a spread |
6% of Semi-Annual coupon. NTNs are indexed and issued by series. |
Zero coupon |
|
Outstanding Public Debt |
The creation in 1973 of the Chicago Board Options Exchange to trade listed options pushed forward the options market. Nonetheless, a final factor that improved this market was the rising volatility of interest rates after 1979.
In the earlier eighties, fixed-income securities were not listed and traded in U.S. Exchanges. When interest rates turned volatile, financial market learned, at great cost, that financing long-term, fixed-rate assets with short-term, floating-rate funds was a high-risk proposition.
Nowadays, the fixed-income market does not survive without option market. In the U.S. all Exchanges have created listed options on Treasuries and listed options on financial futures.
There are two types of option agreements: the American and the European options. An American option may be exercised on any day up to and including its expiration date. On the other hand, a European option must be exercised on its expiration date.
We can have put options and call options; to every option transaction there are two parties, a buyer and a seller, usually referred to as the holder and the writer. The holder of a call option has the right to buy, until the expiration date (strike date), the underlier (a commodity, a financial instrument, or a notional principal on a rate agreement) from the counterparty, who is called writer. The writer must sell the underlier at a specific price when required by the holder. In addition, the holder of a put option has the right to sell, until the expiration date, to the counterparty.
It is easy to observe how security borrowers and sellers might use an option as a form of insurance, given the conditional nature of the option of it. The premium to be paid for this insurance is the difference between the price of the option and its intrinsic value.
A call option has positive intrinsic value if the market price of the undelier exceeds the strike price; on its turn, a put option has positive intrinsic value if the market price of the underlier exceeds the strike price. Both call and puts options have zero intrinsic value if the market prices are equal to strike price. Finally, they have negative value if the market prices are less than the strike.
Within the market bond the options work with call or put provisions.
When a bond contains a call feature or provision, the issuer retains the right to buy the security before the maturity date. If the market rates are falling, this permits that borrower to replace the bond issue with a lower-cost issue. Other benefit in a call provision is the possibility for borrowers to use unexpectedly levels of cash to retire outstanding debts or restructure their liabilities.
Because the call provision is detrimental to the investor, who runs the risk of loosing a high-coupon bond when rates begin to decline, callable bonds carry higher yields than bonds that can not be retired before maturity.
In its turn, a putable bond grants the investors the right to sell the issue back to the issuer on designated conditions and dates. In the put provision, the investor has the advantage of forcing the issuer to redeem the bond. It happens when the interest rates are rising after the issue date, thereby reducing the value of the bond.
Finally, a typical provision in the private bond market is the sinking-fund provision. This option requires the obligor to retire certain amount of the outstanding bonds of the market each period. Government debt is generally free of this provision.
There are well-developed and sophisticated theories about the valuation of a call or put option. Messrs. Black and Scholes publication of the models for pricing European calls non-dividend-paying equities is one of the most useful models that facilitated the trading of options. We do not intend to show this model at this time, which would be very extensive.
The short form of repurchase agreement is Repos. As the term sale-repurchase agreement describes more accurately the transaction, the Street people usually talking about doing repos and reverses.
When one says "he is doing to repo securities," he means that he is going to finance securities he owns or securities he has reversed in; on the other hand, if an investor says he is going to do repo, that means he is going to invest in repo, or finance someone else’s securities.
In terms of financing, repos and reverses do not differ from other operations. The economic essence of the transaction is that they are collateralized loan, not a pair of securities trade. In short, on the day the transaction is initiated, the securities are sold against money; and on the day the transaction is unwound, this operation is reversed – that means the money and the bonds return to the original holders with the initial money holder getting something else as interest payment for the use of the money during the period of the operation.
The players of this market are investors who have excess money willing to apply in very short term without risk and investors who are applied in intermediate or long term needing "hot" money.
Many smaller investors that will not trade their portfolios will occasionally reverse out securities for several reasons, among them because repo money are inexpensive than other types of money, and because – in the case of term repo – they expect the interest rates to rise and they need money, or because they see an opportunity to arbitrage.
Indeed, the great risk of this game is what an unsophisticated portfolio manager can face. Buying long bonds assets as a basis for arbitraging and not realizing how great a price risk is assuming. That means financing long-term fixed income with short-term floating rates. Note that risk arises here because the securities are purchased as part of an arbitrage rather than as a long-term investment.
However, there is no liquidity in a term repo; it is not an asset that can be sold, and the underlying agreement cannot be broken. Thus, one might argue, as many have argued, that investors who put securities in their liquidity portfolios out on term repo are impinging on their liquidity. Actually, they are not. In most of the time investors are reversing out securities that they would not consider selling. Yet, whatever happens they ever can raise money by selling or repoing the asset collateralized
In late 1984, the U.S. Treasury declared that henceforth any 10-year note or any 20 or 30 year bond that it was issued could be stripped via the book-entry system. That meant the openness of the possibility to trade coupon separately of the principal. In other words, each 60 semi-annually coupons of a 30-year bond and its principal could be sold with different yields.
The Treasury decided to preempt by itself the profits earned by some dealers since 1982, when Merril Lynch funding on Treasury Securities started to sell its own zeros.
The great appeal that Zero Coupons have among investors is their simplicity. Investors know that, if he or she invests X "money" today, he or she will get Y "money" at the end of some known time. On the other hand, recalling volatility, zero coupon displays much more risk than does a coupon security with the same maturity.
In the United States, Zeros have been used for all kinds of commercial promotions: auto dealers have offered as an incentive to buyers of new cars; state lotteries have used them to defer payoffs to winners; and so on.
Whether an investor will or not make money stripping a given security depends on the relationship between the market value of that bond and the market value of the sum of its parts.
In the U.S., there is a distinction between STRIPs that correspond to principal (corpus) and those that correspond to coupons. This distinction is made because of the tax system. As the Japanese investors were not taxed on income from a zero corpus until the maturity, the U.S. Treasury has to appeal for that reason.
Carrying on US$ 5,4 trillion, the United States has the most liquid security market of the World. Perhaps, the size of this market stimulates several strategies of portfolio management that turned the U.S. bond market extremely liquidity.
The range of portfolio strategies has increased as well as the technology of analysis has developed over time. In the following lines are shown some characteristics of the U.S. Treasury Debt Management.
The Treasury issues three types of marketable securities – bills, notes, and bonds. All marketable bonds are issued in a book system entry.
Treasury bills are short-term securities with original-issue maturities of 13, 26 and 52 weeks and cash management bill, whose can have various maturities. Bills are issued at a discount bond from face value and are redeemed at their face value maturity.
Notes have fixed maturities of more than 1 year and not more than 10 years. They are issued with a stated rate of interest, earn interest semi-annually, and are redeemed at par at maturity. Nowadays, Treasury offers notes with original issue-maturity of 2,3,5 years and 10 years.
Bonds are long-term securities with fixed maturities of more than 10 years. The Treasury currently offers 30-year bonds in February, August, and November. The Treasury may reopen an outstanding bond in order to enlarge the size of an issue and enhance its liquidity.
Finally, in January 1997, the Treasury began auctioning inflation-indexed securities (IIS). The principal of the security is adjusted daily for changes in inflation, with the adjustment payable at maturity. Semi-annual interest rates are a fixed percentage of inflation-adjusted principal at the time of the interest is paid.
The Treasury does not issue zero-coupon marketable securities. However, notes, bonds, and IIS are permitted to be stripped into their interest and principal components.
The Treasury current auction techniques to all marketable are carried out on a yield basis. Until 1983, the bids were received on basis of the price of the security.
Ordinarily, there is a period of one to two weeks between the time a new Treasury security is announced and the time the security is actually issued. Trading during on a when-issue period basis is permitted that provides for price discovery and reduces uncertainties surrounding Treasury auctions. Potential competitive bidders look to when-issued trading levels as a market gauge of demand to determine how bid at an auction. The regular, predicable-offering schedule has helped the Government’s borrowing costs by lessening the uncertainty surrounding Treasury auctions.
Multiple-price auctions occur in all marketable bids, with exception of the 2 and 5 year note auctions, and auctions of inflation-indexed bonds. In multiple-price auctions, the bidders are ranked by yields from the lowest yield to the highest yield until the achievement of the amount offered to the public. Each competitive bidder whose tenders are accepted pays the price equivalent to the yield that they bid.
Single-price auctions have been occurring to monthly sales of 2 and 5-year notes since 1992, and inflation-indexed securities since the beginning. The auctions are in terms of yields, and coupon is determined after the auction. As in the multiple-price auctions, bids are ranked from the lowest yield to the highest that is required to sell the amount offered. The difference is that in the single-price auctions all awards receive the highest yield.
The public security market was developed under the 1964 Reform of Brazil Financial System. Nowadays, there is a well-structured and active market for financing Brazil current public debt.
Since 1968, Brazil has been done monetary policy through open market operation. At that time, the Treasury Bills (LTN) were created as a national currency denominated security. Once they were sold in national currency and at discount rate, LTN become a fundamental instrument to the open market operations.
However, as the international market showed excess of liquidity, sometimes with a negative yield, domestic savings did not have incentive to occur. Until latest seventies, Brazil used this excess of liquidity in the international market to finance its public deficits.
By the end of seventies, as the interest rates had became extremely high within international market, the role of the Treasury Bills (LTN) into open market operation increased rapidly.
The fall in the international capital flows, in early eighties, and the increase in the current-deficit account, brought a fast raise in the public debt as alternative to finance the constant budget deficit. Nevertheless, the raises in money supply affect the price level and inflation reached 235% in 1985.
Several macroeconomics plans followed one after other, as tentative to stop with the hyperinflation spiral.
In 1986, Executive Branch looking for a better control in the public finance adopted the follow measures:
The Brazil Treasury issues two types of securities: Bills and Notes. All of them are issued through an electronic system under Central Bank administration.
Treasury Bills are called by LTN – Letras do Tesouro Nacional (National Treasury Bills) or LFT – Letras Financeiras do Tesouro (Treasury Financial Bills). The LTN is REAL denominated, does not have coupon, and is sold by discount. The LFT is REAL denominated, also does not have coupon, and is sold by discount, but it is indexed at daily floating rates to be paid at the end of maturity. Since Plano Real was launched, the Treasury has been issuing more frequently LTN as the main instrument to finance its deficit. On its turn, the LFT has been issued in volatile periods and to special operations as the government bailout to states in late 1997. All bills can be sold with original-issue maturity until 30 years.
Notes are called by NTN – Notas do Tesouro Nacional (National Treasury Notes). The NTNs are generally indexed. The indexes depend on each series. They were designed to have longer maturities than the bills. Nevertheless, they have been issued with either short-term or long-term. They are sold by discount, and they usually pay semi-annual 6% fixed rate interest. Some NTNs series have been used on Treasury special operations like Banco do Brasil capitalization or restructuring of some government companies under the Privatization Program. The NTNs can be sold with original-issue maturity until 30 years.
The charts below show the main instruments ordinarily used by the Treasury to financing its deficits:
|
Security |
Enactment |
Objectives |
Characteristics |
|
LFT |
DL nº 2376/87 |
- Financing budgetary deficit |
Discount bond. Floating rate index to diary market-to-market interest rate |
|
LTN |
DL nº 1079/70 Res.CMN nº 564/79 DL nº 2376/87 |
- Financing budgetary deficit |
- Discount bond |
|
NTN |
Lei nº 8177/91 Lei nº 8249/91 Dec.nº 1732/95 Dec. Nº 1837/96 Dec. Nº 1839/96 M.P. nº 1486/96 |
Financing budgetary deficit Used for special operations with previous legal provision. |
Indexed bond series. |
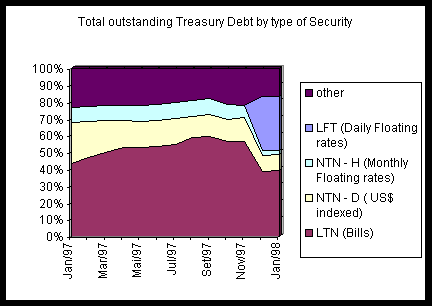
The Treasury has been increasing the portfolio strategies as well as the technology of analysis the results of its auction over the last couple of years.
In 1994, the Treasury used to have one auction by month, regularly. There was not so much forecasting about what type of securities the Treasury could offer to the market. There were auctions announced on the same day.
Since then, there is tendency to raising the foreknowledge of the market players on Treasury steps. What the researches have demonstrated is that as less predicable are the auctions; the higher is the cost for the Treasury. Nowadays, the schedule of Treasury auctions is announced months in advance. The auctions are weekly, and regularly at the same day. However, the amount and the type of securities to be sold continue to be announced only few days in advance.
The Treasury current auction technique for all its securities is based on the Multiple-price type. The Bills auctions are based on a price of securities and the Notes auctions are based on the yields.
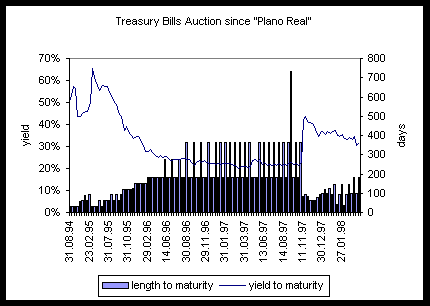 The graph below shows the Treasury Bills auctions results since Plano Real was launched in 1997:
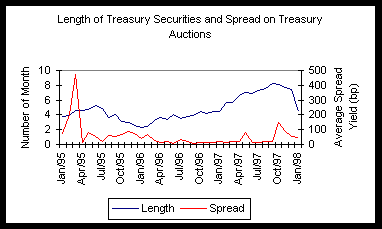
The next chart presents data concerning the average length and the cost on Treasury debt:

The secondary market of Brazil Treasury securities is an over-the-counter market in which groups of financial institutions offer continuously and ask prices on specific outstanding Treasuries.
Investors in bills and notes expose themselves, as a buyer of discount securities, as well as the Treasury also exposes itself, like seller of these securities.
What determines the liquidity of a security trading on secondary market is the spread between the price offered and the price asked by the financial institutions.
The term liquidity refers to nearness to money. The most liquid asset is money. Market perceptions of an economic situation of the borrower affect the liquidity of the securities issued immediately.
In general, the secondary market drives the primary market. If there is a liquidity and active secondary market, there are good conditions for borrowers to financing their needs. In case where the secondary market is more liquid also is observed less cost, and vice versa.
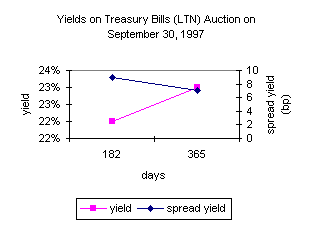
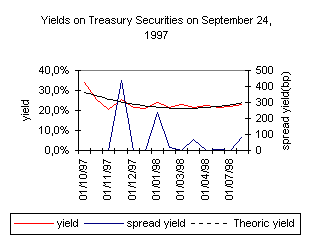 The following graphs show this relationship. Before Asia’s crises what we observe is a downward yield curve on secondary market with a slightly raising in the end of the curve. In the Treasury auction there is the reflection of market’s liquidity, which means almost zero spread on the bidden.
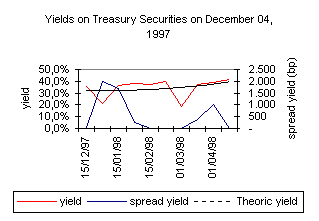
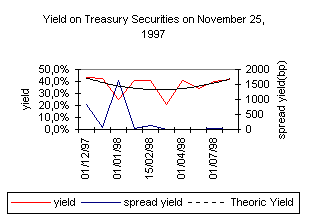 On the other hand, during Asia’s crises, the Brazil’s Central Bank raised the interest rate, and as the market could not foresee what would be the consequences of the crises, the secondary market also raised the spread yield in order to cover the associated risk, bringing less liquidity as outcome. Thus, during this period, there was not primary market for the Treasury to borrow money.
The words could be stability and predictability. These factors determine the liquidity on the market bonds. Nevertheless, in most of the time these factors are exogenous.
The Brazil’s financial market is sophisticated and well developed. We can consider this market an efficient market, where the players have enough information and today’s price is the best predictor of tomorrow’s price. At exogenous occurrence, the changes are immediate.
As far as we could study, the International experience does not bring more news on the already well-developed Brazil’s financial market. It is true that they have developed many instruments to improve their markets. However, the macroeconomic situation of the country responds more for the liquidity on financial market than any specific instrument.
The level of inflation in the last year, and the constant changes within the Brazil economic policy, maintained the unpredictability of almost all variables that determine the price of the bond. The market could not estimate inflation, interest rate, level of employment, productivity, or even the real wage, so fast the elements were changed during that period.
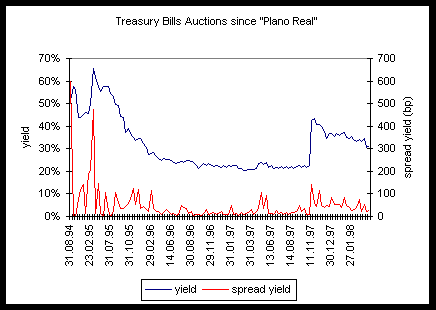 Since Plano Real had brought more stability and predictability for the Brazil economy, we could observe some changes in the market behavior. The graph below present us an relation between the results of Treasury auctions and the spread yields on these auctions:
As outcome, the stability of the secondary market also has permitted the lengthening of the maturity the Treasury securities. The first impression is that the strategy of lengthening could raise the cost of the Treasury debt. Nonetheless, the relationship between average length of the Treasury debt and its cost show that the strategy resulted in less on management of the debt.
The next graph illustrate how the volatile on Treasury auction reduced when the length of the debt increased, and vice verse:
It is quite certain that the stability of the economy is who leads the liquidity of secondary market. Below we show two graphs on yields on Treasury Bills (LTN). The first one is on September 24, 1997, so before the Asia’s crises. The other one is on November 24, 1997, so after the crises that leaves the countries of the Asian Southern to bankrupt.
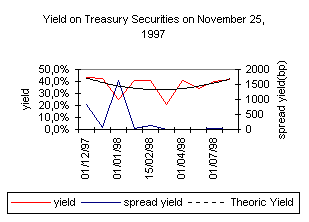
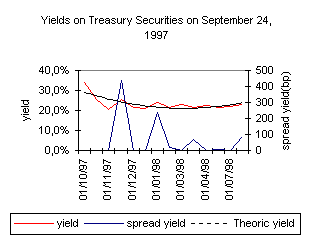
The graphs above show exactly what happens when the market loses the capability to foresee the future. The liquidity of this future is instantaneously lost and the spread yield is amplified.
When we have a high volatile environment, the investors prefer to purchase bonds at short-term, and they require higher yields to change and to buy bonds of other maturities. As predicted by the preferred habitat theory, any shape of interest rates’ term structure can occur. This theory can explain during the most of the time the shape of the yield curves on Treasury securities.
Finally, another element analyzed was the relation between the amount offered by the Treasury on its auctions, the amount demanded, and the yield spread.
The conclusion that we took from this analysis was the existence of a weak relationship between the index offer/demand and the spread yield. Below we present this relationship:
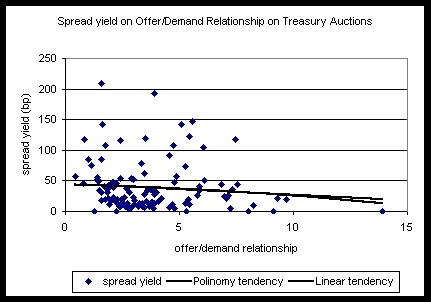
Based on the theories that we revised and presented in this paper as well as the data observed, these are the proposals that we could suggest for further development on Brazil Treasury securities:
Someone would ask: Is that enough? Another would ask : Is that not too much?
None of us can be sure whether the first or second question is more appropriate. Nonetheless, the answer would be: It is too much and it is not enough.