4. Video analysis with LoggerPro (LP)
Video clips can be downloaded into logger pro for quantitative analysis of position data as a function of time. The program will step through the movie one frame at a time and when a marker is placed on the image in the frame (red dot), the x and y coordinates of point will be entered in the data column, along with a time corresponding to that frame of the movie. In addition, the point will be placed in a plot that is created at the same time. When additional points are added, the velocities of points are calculated, based upon the time elapsed between movie frames and the distance between one point and the next.
Each film clip stores information about the frame rate and LoggerPro reads this in order to determine the elaapsed time between each step. Therefore, when creating movies, attention should be taken to get the right frame rate. When using a movie obtained from another source, then be sure to check that the frame rate properly corresponds to the physical situation being depicted. If the frame rate is incorrect, then the movie can be reparsed to correct this problem. For this, use a program called ImageJ. More instructions will be given upon request. For now, though, be aware that since the frame rate can be changed in a movie, you must be skeptical of the timing of movies obtained from other unknon sources. Of course, with your own movies, you can have a little more confidence.
Instructions for inserting a movie:
- Insert the movie into your LP session: Menu --> Insert -->Movie

- Navigate to the movie and double click on it.
- Now resize the movie and open the video analysis toolset by clicking on the red dot-dot-dot button in the lower right hand corner of the movie. This is circled in the figure below.
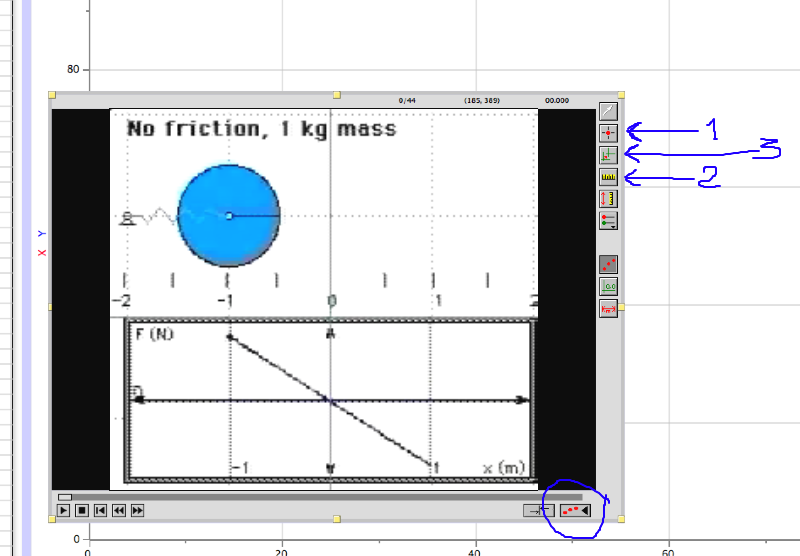
- Now labeled in the Figure above a three important buttons:
- Pressing button #1 will record the position of the crosshairs when the mouse is clicked and then will avance to the next frame. Keep doing this to record the position of an object (in this case the center of the blue ball) in each frame
- Sets the scale of the graph. Clicking the mouse at -1 and holding it while moving to 2 will draw a green line across the screen. When the mouse is released a dialogue box will open, into which you may type the length of the line. This provides a length scale for the movie.
- This button sets the origin. Simply click to mouse where you want the origin to be.
- Now, you are ready to go. If you perform the above three operations (and #1 several times), you should get the result below:
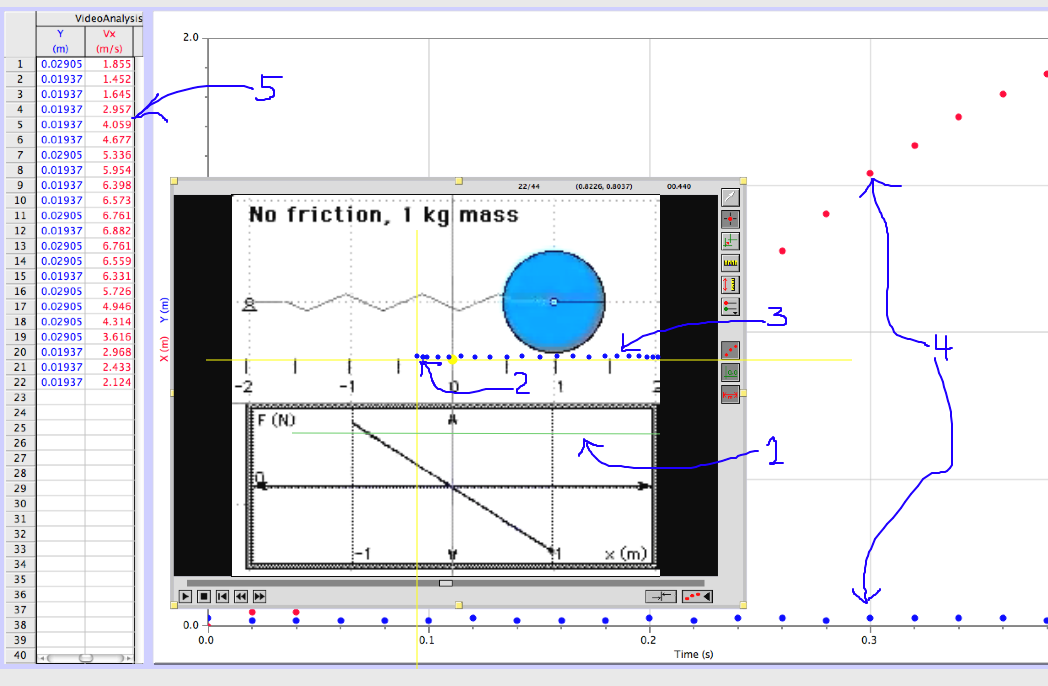
- The items labeled above are the following:
- Faint green line is the length scale (in this case, 3 m)
- Is the origin
- Are the points representing the center of the blue ball for the first 22 frames. -- Notice that these points, the origin, and the scale are offset below and to the right. This is a bug in the Mac version of Logger Pro. I have contacted them about this. It is annoying, but does not change the accuracy of the results.
- The x (red) and y (blue) corrdinates plotted vs. time
- The values of the x and y coordinates of each of the blue points.
Now, you have some data that you can analyze. In addition to the x and y values, the x and y components of the velocity (Δx/Δt, Δy/Δt) are recorded, where Δt is the time between frames.